
2026 Farmers Insurance Open - Patio Preview, Key Stats, Tournament Trends & Early Models
Follow: X - BettorClubhouse | IG - TheBettorClubhouse | Threads – TheBettorClubhouse


Patio Preview
Torrey Pines Golf Course (North & South Course)
La Jolla, California
Brooks Koepka is officially BACK on the PGA Tour!
Two-course rotation this week
Playing typical Thurs-Sun schedule since no NFL to compete with this year
147 players, Top 65 & ties make cut
North Course
Considered easier of the two courses (assuming no wind like R2 last year)
2025 Round 1 Scoring Average: -1.8
2025 Round 2 Scoring Average: +3.2
One round will be played here (three at South)
About 500 yards shorter than South
No Shotlink at North Course
Par 72; ~7,250 yards
Greens: Bent mixed with Poa
Avg size: ~6,000 sq ft
Narrow fairways around 25 yards on average
SG: OTT and Driving Accuracy most challenging on this course, as well as Par 3s
If you like Showdown DFS contests, target this course in the first two rounds (again, assuming wind situation is not like it was R2 of 2025 tournament)
South Course
Considered to be very difficult
Golfers will play one of first two rounds here, and then both of weekend rounds
Par 72; ~7,770 yards
Very long
Greens: Poa Annua
Small average green size: ~5,000 sq ft
Bumpy and inconsistent greens that are challenging to putt on
Similar agronomy to that of Pebble Beach and Riviera
Rees Jones renovations from William Bell original design
80+ bunkers but not much water at all (only 1 hole)
Narrow fairways like North Course
Plays above par every year since Covid
Five-year scoring average close to 72.5
PGA Tour Average ~70.5
Birdie-or-Better rate 3% lower than Tour average
Bogey Avoidance rate 4% higher than Tour Average
Birdie-to-Bogey ratio just 0.94
PGA Tour Average 1.44
Driver-heavy course: around 80% driver use last 5 years
10%+ more than Tour Average
Driving Accuracy about 9% below Tour average
Predictably, Distance from Edge of Fairway is above Tour Average here due to narrow fairways
Greens-in-Regulation rate is heavily affected by the wind here
Overall GIR% sub-60% last year when winds were up
Fairway GIR% 4% lower than Tour average
In 2024, overall GIR% almost 68% when winds were down
Fairway GIR% 5%+ over Tour Average and north of 80%
Assuming tame winds, overall proximity about Tour average
At least 70% of Approach shots from 150+ yards
ARG shots will come from rough or sand about 70% of time
Rough is long and Scrambling ARG is considered difficult here
Three-Putt Avoidance rate anywhere from 3.63% to 4.83% last 5 years
PGA Tour Average 2.83%
3PA Rate from 25 feet+ anywhere from 11.13% to 14.5% last 5 years
PGA Tour Average 8.92%
Average distance of birdie putts made anywhere from 9.3 feet to 11.6 feet last 5 years
PGA Tour Average around 9.5 feet
Putting from 3-5 ft notoriously more challenging here than elsewhere due to green inconsistencies
Sub-85% five-year average vs 88.1% Tour Average
Five-year Par-3 scoring average 3.11
5Y P3 BOB% 11.3%
PGA Tour Averages 3.06, 13.2%
Five-year Par-4 scoring average 4.13
5Y P4 BOB% 13.6%
PGA Tour Averages 4.03, 17.1%
Five-year Par-5 scoring average 4.72
5Y P5 BOB% 38%
PGA Tour Averages 4.62, 45.9%
Recent Tournament History
2025: Harris English -8 (68-73-66-73); 1 Stroke Victory over Sam Stevens
2024: Matthieu Pavon -13 (69-65-72-69); 1 Stroke Victory over Nicolai Hojgaard
2023: Max Homa -13 (68-70-71-66); 2 Stroke Victory over Keegan Bradley
2022: Luke List -15 (67-68-72-66); Playoff Victory over Will Zalatoris
2021: Patrick Reed -14 (64-72-70-68); 5 Stroke Victory over 5 players
2020: Marc Leishman -15 (68-72-68-65); 1 Stroke Victory over Jon Rahm
FOLLOW EACH MEMBER OF THE CLUBHOUSE CREW ON THEIR SOCIALS!
Champ - @Champs311
Sammy - @SammyAvBets
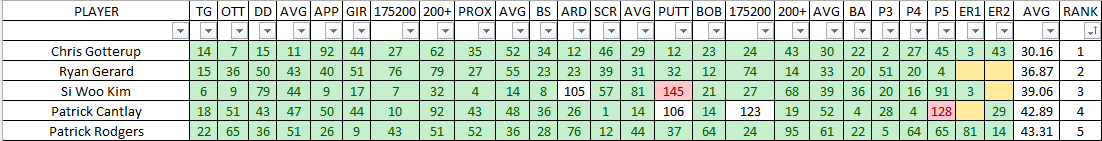
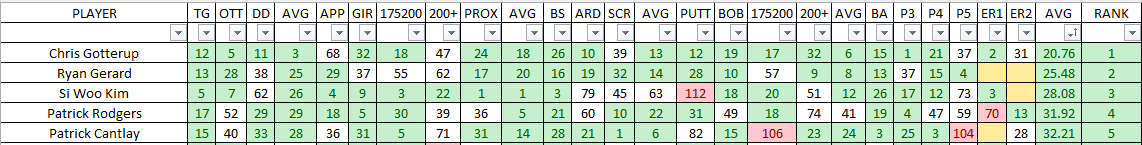
Key Stats
Tier 1
Strokes Gained: Tee-to-Green
Strokes Gained: Off-the-Tee
Strokes Gained: Approach
Total Driving
Greens-in-Regulation%
Tier 2
Strokes Gained: Putting (Poa Annua - west coast swing)
Bogey Avoidance %
Ball Speed
Carry Distance
Distance from Edge of Fairway
Overall Proximity
Par 5 BOB%
Par 3 Scoring
Strokes Gained: Total (Torrey Pines South)
Tier 3
Approach 150-200 Yards
Approach 200+ Yards
Three-Putt Avoidance % (Poa Annua - west coast swing)
Putting Inside 10 feet (Poa Annua - west coast swing - min 8 rds)
Scrambling from Rough %
Sand Saves
Champ’s Course Comps
Stadium Course
Olympia Fields
Caves Valley Golf Club
Memorial Park
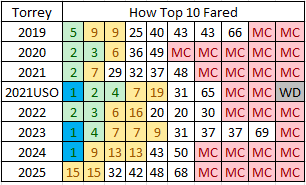
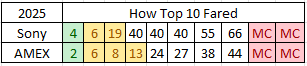
Last 6 Farmers Insurance Open Trends
Odds
0-25: 2023, 2021
26-50: 2020
51-100: 2025, 2022
101+: 2024
Winner’s Strokes Behind Leader By Round
R1: 4/6 (83%) trailed by 4 or more shots (1/6 led)
R2: 3/6 (50%) within 3 shots (0/6 led)
R3: 3/6 (50%) within 1 shot (2/6 led)
Winner’s Lead-In Form
6/6 (100%) with a Top 20 finish in their last 4 starts
5/6 (83%) made the cut in their previous start
5/6 (83%) with a Top 10 finish in their last 4 starts
4/6 (67%) with at least 2 Top 25 finishes in their last 4 starts
4/6 (67%) with a Top 25 finish in their last 2 starts
3/6 (50%) with a Top 5 finish in their last 4 starts
0/6 (0%) with a WIN in their last 4 starts
Winner’s Farmers Insurance Open History
5/6 (83%) with at least 5 prior appearances
4/5 (80%) made the cut in their previous apperance
5/5 (100%) with a Top 10 finish within their last 6 appearances
2/5 (40%) with a Top 5 finish in their tournament history
1/6 (17%) won in their DEBUT
First Round Leader by Course Split
North Course: 100% (2025, 2024, 2023, 2022, 2021, 2020)
South Course: 17% (2020)
*results can include instances where FRL from multiple courses, all get credited with a win.
Early Models

Become a Clubhouse Member to unlock Champ and Sammy’s full models below, including our model weights where applicable
